Question

I would like to generate a canvas image using gradients in some clever way. I would like the image to looks something like this:

rainbow circle

I just can't get my head around it. I need to generate lines in the form and arc - or use gradients with color stops in some clever way. Maybe it would be a lot easier if I converted to HSL and just go through the HUE values?

For example in a rectangle format I could

for (var i = 0; i < h; ++i) {
  var ratio = i/h;
  var hue = Math.floor(360*ratio);
  var sat = 100;
  var lum = 50;
  line(dc, hslColor(hue,sat,lum), left_margin, top_margin+i, left_margin+w, top_margin+i);
}

Does anybody have any clever tips on how to produce this image using canvas?

Was it helpful?

Solution

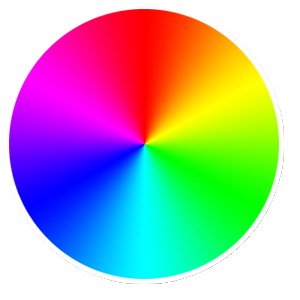
This is not perfect (due to drawing steps ...), but it can help you :

http://jsfiddle.net/afkLY/2/

HTML:

<canvas id="colors" width="200" height="200"></canvas>

Javascript:

var canvas = document.getElementById("colors");
var graphics = canvas.getContext("2d");

var CX = canvas.width / 2,
    CY = canvas.height/ 2,
    sx = CX,
    sy = CY;

for(var i = 0; i < 360; i+=0.1){
    var rad = i * (2*Math.PI) / 360;
    graphics.strokeStyle = "hsla("+i+", 100%, 50%, 1.0)";   
    graphics.beginPath();
    graphics.moveTo(CX, CY);
    graphics.lineTo(CX + sx * Math.cos(rad), CY + sy * Math.sin(rad));
    graphics.stroke();
}

The idea is to draw the disc line by line with a hue value corresponding to the line direction.

You can change the color base rotation by adding a radius angle to rad variable (adding -pi/2 to rad would make the gradient look like your figure).

EDIT: I made a new demo that generalizes the concept a bit and renders a rainbow polygon. Here is the CodePen. To get rid of the small voids beteween the colors, I used quads that overflow to the next color part, except for the last one.

OTHER TIPS

Small adjustment to make it have a white center

var canvas = document.getElementById('colorPicker'); var graphics = canvas.getContext("2d");

        var CX = canvas.width / 2,
            CY = canvas.height / 2,
            sx = CX,
            sy = CY;

        for (var i = 0; i < 360; i += 0.1) {
            var rad = i * (2 * Math.PI) / 360;
            var grad = graphics.createLinearGradient(CX, CY, CX + sx * Math.cos(rad), CY + sy * Math.sin(rad));
            grad.addColorStop(0, "white");
            grad.addColorStop(0.01, "white");
            grad.addColorStop(0.99, "hsla(" + i + ", 100%, 50%, 1.0)");
            grad.addColorStop(1, "hsla(" + i + ", 100%, 50%, 1.0)");
            graphics.strokeStyle = grad;
            graphics.beginPath();
            graphics.moveTo(CX, CY);
            graphics.lineTo(CX + sx * Math.cos(rad), CY + sy * Math.sin(rad));
            graphics.stroke();
        }

Here is an alternate approach that takes a slightly more functional approach:

var canvas = document.getElementById("radial"),
    ctx = canvas.getContext("2d"),
    width = canvas.width,
    height = canvas.height,
    center = { x: width/2, y: height/2 },
    diameter = Math.min(width, height);

var distanceBetween = function(x1,y1,x2,y2) {
  // Get deltas
  var deltaX = x2 - x1,
      deltaY = y2 - y1;

  // Calculate distance from center
  return Math.sqrt(deltaX*deltaX+deltaY*deltaY);  
}

var angleBetween = function(x1,y1,x2,y2) {
  // Get deltas
  var deltaX = x2 - x1,
      deltaY = y2 - y1;

  // Calculate angle
  return Math.atan2(deltaY, deltaX);
}

var radiansToDegrees = _.memoize(function(radians) {
    // Put in range of [0,2PI)
  if (radians < 0) radians += Math.PI * 2;

  // convert to degrees
  return radians * 180 / Math.PI; 
})

// Partial application of center (x,y)
var distanceFromCenter = _.bind(distanceBetween, undefined, center.x, center.y)
var angleFromCenter = _.bind(angleBetween, undefined, center.x, center.y)

// Color formatters
var hslFormatter = function(h,s,l) { return "hsl("+h+","+s+"%,"+l+"%)"; },
    fromHue = function(h) { return hslFormatter(h,100,50); };

// (x,y) => color
var getColor = function(x,y) {
  // If distance is greater than radius, return black
  return (distanceFromCenter(x,y) > diameter/2)
    // Return black
    ? "#000"
    // Determine color
    : fromHue(radiansToDegrees(angleFromCenter(x,y)));
};

for(var y=0;y<height;y++) {
  for(var x=0;x<width;x++) {
    ctx.fillStyle = getColor(x,y);
    ctx.fillRect( x, y, 1, 1 );
  }
}

It uses a function to calculate the color at each pixel – not the most efficient implementation, but perhaps you'll glean something useful from it.

Note it uses underscore for some helper functions like bind() – for partial applications – and memoize.

Codepen for experimentation.

Licensed under: CC-BY-SA with attribution
Not affiliated with StackOverflow
scroll top