How to plot values with log scales on x and y axis or on a single axis in R?
-
10-10-2020 - |
 italiano
 english
 français
 española
 中国
中国 日本の
日本の العربية
 Deutsch
 한국어
한국어 Português
 Russian
Question
How to plot values with log scales on x and y axis or on a single axis in R?
We can plot numerical values in R with many scales and that includes log scale as well. Also, it is possible to plot the values with log scales on both the axes. In base R, the best way to do this is defining the axes values with decimal representation as shown in the below examples with well-defined log.
Consider the below vector −
Example
set.seed(555)
x<-sample(1:9,10,replace=TRUE)
x
Output
[1] 4 8 7 5 6 1 9 2 1 8
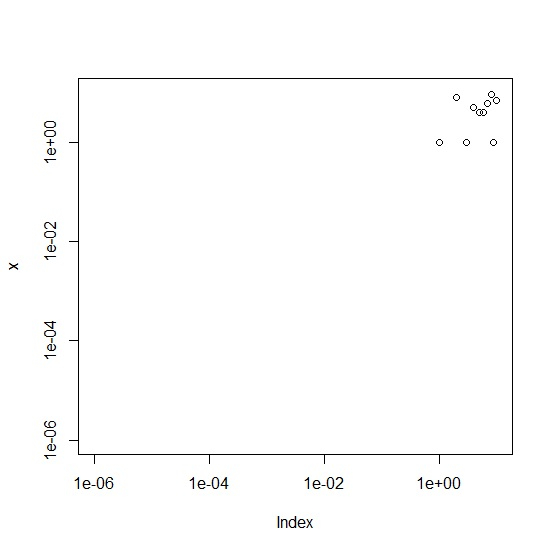
Creating plot of x with log scale on both, x and y axis −
Example
plot(x,xlim=c(0.000001,10),ylim=c(0.000001,10),log="xy")
Output
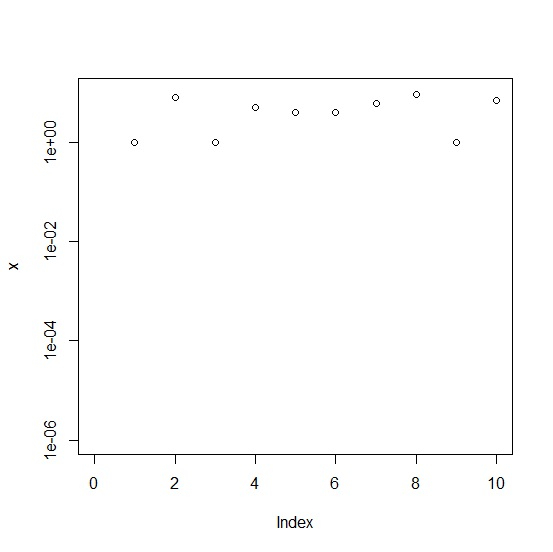
Creating plot of x with log scale on y axis only −
plot(x,xlim=c(0.000001,10),ylim=c(0.000001,10),log="y")
Output
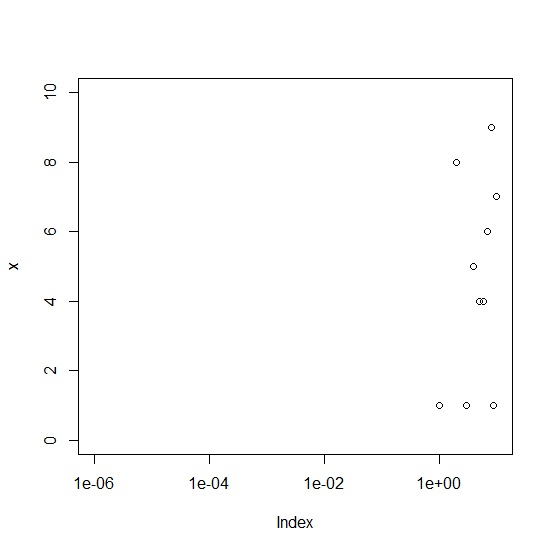
Creating plot of x with log scale on x axis only −
plot(x,xlim=c(0.000001,10),ylim=c(0.000001,10),log="x")
Output

Published on 09-Oct-2020 19:00:10
Advertisements
Not affiliated with Tutorialspoint
