How to increase the size of points on a scatterplot if the points are drawn based on another sequence using ggplot2 in R?
-
10-09-2020 - |
 italiano
 english
 français
 española
 中国
中国 日本の
日本の العربية
 Deutsch
 한국어
한국어 Português
 Russian
سؤال
How to increase the size of points on a scatterplot if the points are drawn based on another sequence using ggplot2 in R?
When we draw a scatterplot using ggplot2 with points based on a sequence of values then the size of the points might be very small for the small values. As a result, it becomes a little difficult to view the points. Therefore, we might want to increase the size of those points. It can be done by using scale_size_continuous function in which we can set a range for the points size.
Example
Consider the below data frame −
x<-rnorm(10,1)
y<-rnorm(10,2)
Pair<-1:10
df<-data.frame(x,y,Pair)
df
Output
      x       y         Pair
1 0.2722750 0.7855144    1
2 0.6708724 2.8385502    2
3 1.6939261 1.7415868    3
4 0.5773440 2.1596557    4
5 0.1965571 0.7356820    5
6 0.3368027 1.4774414    6
7 0.8248820 2.8211750    7
8 -0.3364834 2.5258274   8
9 -0.3229903 1.1579749   9
10 -1.1594988 1.0636472  10
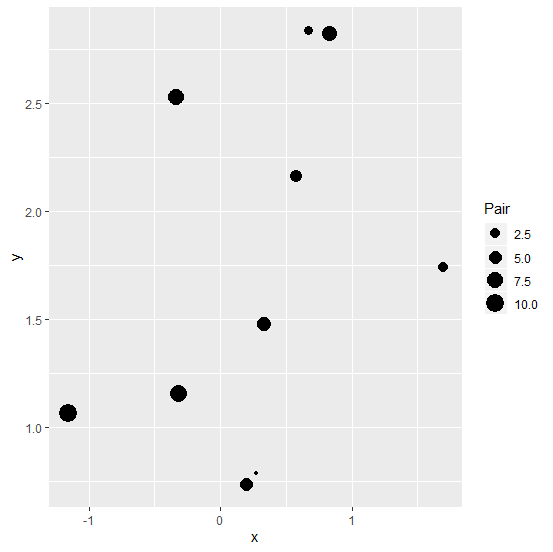
Loading ggplot2 package and creating a scatterplot with points size based on Pair column −
Example
library(ggplot2)
ggplot(df,aes(x,y,size=Pair))+geom_point()
Output
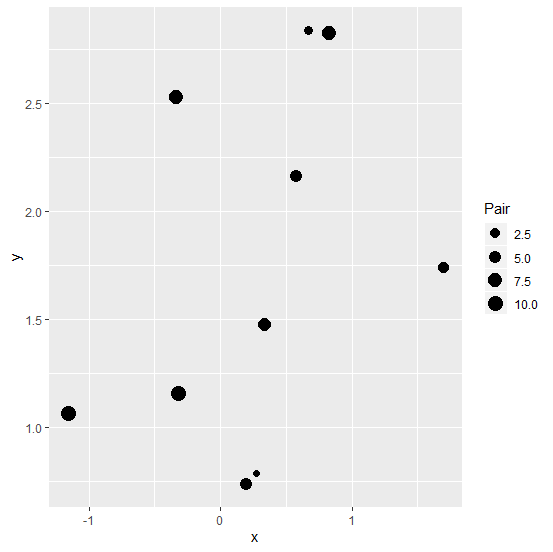
Creating the scatterplot with a range of point size −
Example
ggplot(df,aes(x,y,size=Pair))+geom_point()+scale_size_continuous(range = c(2,5))
Output

Published on 08-Sep-2020 16:34:56
Advertisements
لا تنتمي إلى Tutorialspoint
