How to create bar plot of means with error bars of standard deviations using ggplot2 in R?
-
10-09-2020 - |
 italiano
 english
 français
 española
 中国
中国 日本の
日本の العربية
 Deutsch
 한국어
한국어 Português
 Russian
题
How to create bar plot of means with error bars of standard deviations using ggplot2 in R?
If we have summary data for a group variable then we might want to look at the errors or say differences between mean and standard deviations visually, therefore, we can create a bar plot with error bars of standard deviations. This can be done by using geom_errorbar function of ggplot2 package.
Example
Consider the below data frame −
Group<-c("A","B","C","D")
Mean<-c(24,28,25,24)
SD<-c(2,5,4,3)
df<-data.frame(Group,Mean,SD)
df
Output
 Group Mean SD
1  A   24    2
2  B   28    5
3  C   25    4
4  D   24    3
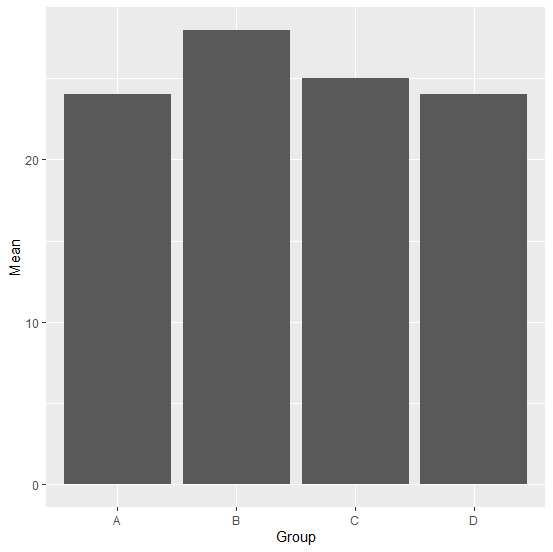
Loading ggplot2 package and creating bar plot of means −
Example
library(ggplot2)
ggplot(df,aes(Group,Mean))+geom_bar(stat="identity")
Output
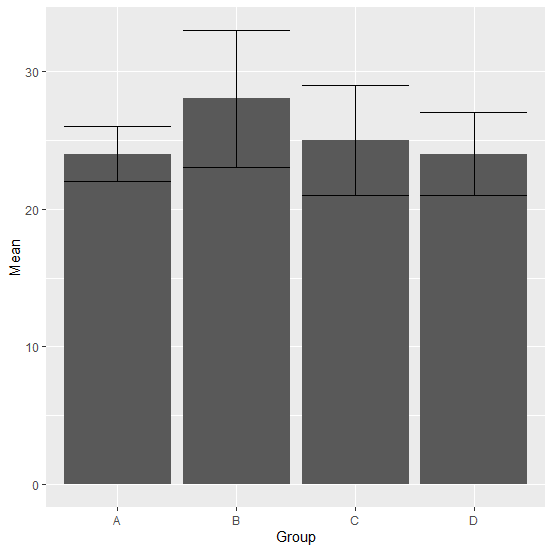
Creating bar plot with error bars of standard deviations −
Example
ggplot(df,aes(Group,Mean))+geom_bar(stat="identity")+geom_errorbar(aes(x=Group,ym
in=Mean-SD,ymax=Mean+SD))
Output

Published on 08-Sep-2020 14:49:25
Advertisements
不隶属于 Tutorialspoint
