svg diagrams using python
 https://stackoverflow.com/questions/634964
 italiano
 english
 français
 española
 中国
中国 日本の
日本の العربية
 Deutsch
 한국어
한국어 Português
 Russian
Question
I am looking for a library to generate svg diagrams in python (I fetch data from a sql database). I have found python-gd, but it has not much documentation and last update was in 2005 so I wonder if there are any other libraries that are good for this purpose.
I am mostly thinking about simple line graphs, something like this:

Solution
As you're looking for simple line graphics, probably, CairoPlot will fit your needs as it can generate svg output files out of the box. Take a look at this.
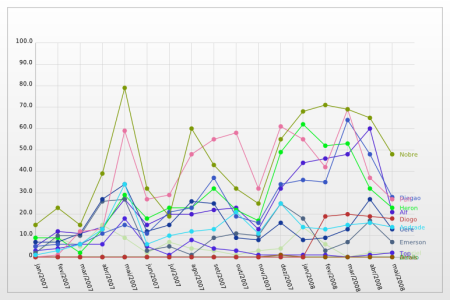
This example image shows only a few of its capabilities. Using the trunk version available at launchpad you'll be able to add a legend box and add axis titles.
Besides that, using the trunk version, it's possible to generate:
- DotLine charts (the ones I believe you need)
- Scatter charts
- Pie/Donut charts
- Horizontal/Vertical Bar charts
- Gantt charts
OTHER TIPS
Try using matplotlib. You can configure it with a SVG backend.
PyChart "is a Python library for creating high quality Encapsulated Postscript, PDF, PNG, or SVG charts."
pyCairo is an option worth looking at.
Here's a general purpose SVG library in Python: pySVG.
Consider svgwrite http://packages.python.org/svgwrite/
svgfig is worth a look:
Being not exactly related to SVG plots, but searching for the same thing I have found a good source of carefully collected useful info to answer your question: http://wiki.python.org/moin/NumericAndScientific/Plotting
I have tried to collate a list of available charting libraries(its an ongoing work, wherein i keep updating the list) : http://blizzardzblogs.blogspot.com/2010/12/data-visualization-charts-and.html
I feel that protovis would do the job for you. Its
- light weight,
- generates svg (which can be exported easily) and
- is javascript
So nothing more to learn :)
2018 Update:
Plotly ( https://github.com/plotly/plotly.py / https://plot.ly/d3-js-for-python-and-pandas-charts/ ) is probably the most versatile solution. It is distributed under MIT license (free to use and reuse), although it include features that might not be compatible with some CMS with more restrictive security issues since it relies on JS, although options to export the diagrams as plain SVG are also available.
Pygal ( https://github.com/Kozea/pygal / http://pygal.org ) is simpler relies only on svg standard. As such it's results are more reusable under more restrict CMS systems. It is distributed under GNU license.
