Instruments Leaks - Not showing my source code
 https://stackoverflow.com/questions/728088
-
05-09-2019 - |
 italiano
 english
 français
 española
 中国
中国 日本の
日本の العربية
 Deutsch
 한국어
한국어 Português
 Russian
Question
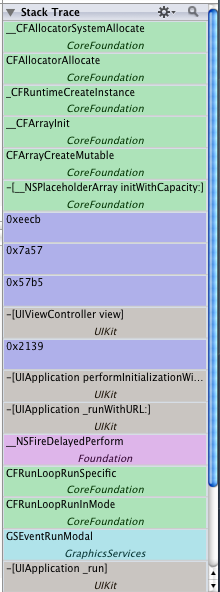
I am attempting to analyze an iPhone application using the Leaks application and everything appears to be working fine, except for when I try to view detailed information about a particular memory leak. Leaks does not appear to be loading my source code. Looking at the stack view on the right, I can see calls that reference iPhone frameworks, but anything that is referencing source code that I've written is empty. The screenshot below illustrates my point. The blocks that are light blue should be referencing my source code. Has anyone ever had this problem? Is Leaks just not finding my source code/symbols correctly? Thanks!
EDIT: I am compiling the app using the 'Device - iPhone OS 2.2' with the Debug configuration. I launch Leaks by selecting Run->Start With Performance Tool->Leaks from within Xcode. How would one go about 'making the symbol files available' for Leaks?

(source: andrewgarrison.com)
Solution
Remove any non-ascii characters from both your your startup disk
and hostname (see the Sharing panel in System Preferences)
and restart.
Ta da!
OTHER TIPS
For iOS 4.0 and higher, the way to fix symbols and turn those useless memory addresses into beautiful file names, function names and line numbers is as follows:
- In Xcode, go to Run -> Run with Performance Tool and choose your instrument
- After Instruments loads, hit the Stop button to stop recording. Go to File -> Re-Symbolicate Document.
- In the new window, click Path and click the plus (+) button to add a new path. Navigate to the folder containing your project file and click Open. Click Symbolicate.
- Profit!
I was looking for this for a good month before I finally came upon the solution. I hope this helps some of you!
I saw this happen, but on a different configuration. In Snow Leopard 10.6.1, Xcode 3.2, Instruments 2.0, I wasn't getting any symbols in Leaks when running iPhone OS 3.0 in the simulator. Searching in Apple's iPhone developer forums revealed that this was a known issue with the iPhone 3.0 SDK (that was being worked on), and switching the active SDK to 3.1 was a workaround. Sure enough, it worked for me!
Project > Edit Project Settings
Choose Debug target
Click Build Tab
Make sure Strip Linked Product is unchecked
Did you compile in debug mode and make the symbol files available?
If your build target directory starts with "." (e.g. I was using ".xcode-build") then the .dsym files will not be found. For my case, changing the build directory to be "xcode-build" fixed the problem and now all my application's symbols show up in stack traces!
I had the same problem. It turned out I had set the build directory to /tmp/xcode. Changing this back to the default fixed the problem. This was with Xcode 3.2.3.
I have Snow Leopard with Xcode 4.5.2 - Instruments 4.5 Once i have set default Debug location to Legacy it started showing
Go to File ----> Project Settings ----> Advanced ---Select Legacy

