How to change the color and size of the axes labels of a plot created by using plot function in R?
-
10-09-2020 - |
 italiano
 english
 français
 española
 中国
中国 日本の
日本の العربية
 Deutsch
 한국어
한국어 Português
 Russian
Question
How to change the color and size of the axes labels of a plot created by using plot function in R?
The default size of axes labels created by using plot function does not seem to be large enough and also it does not look appealing. Therefore, we might want to change their size and color because the appearance of a plot matters a lot. This can be done by setting colors with col.lab and size with cex.lab.
Example
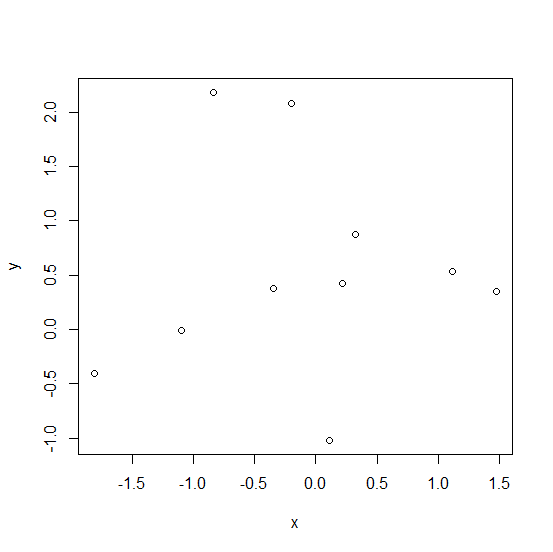
> x<-rnorm(10)
> y<-rnorm(10,0.5)
> plot(x,y)
Output
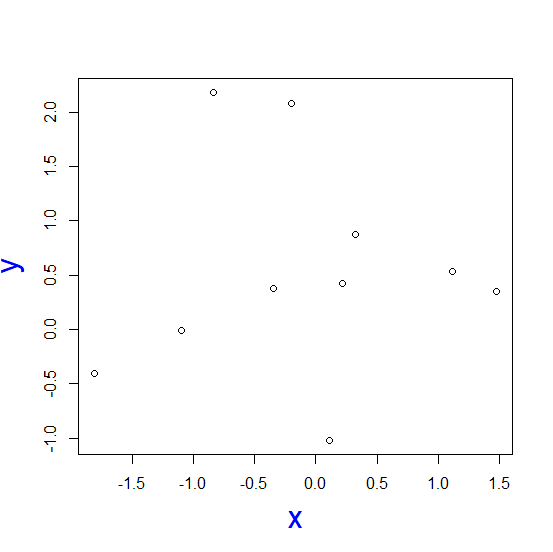
Changing the color of axes labels and the size of those axes labels −
> plot(x,y,col.lab="blue",cex.lab=2)
Output
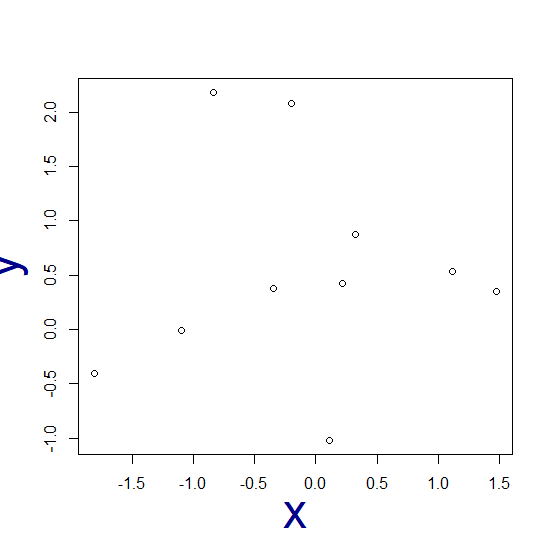
> plot(x,y,col.lab="dark blue",cex.lab=3)
Output

Published on 04-Sep-2020 15:45:38
Advertisements
Not affiliated with Tutorialspoint
