How to change the Y-axis values in a bar plot using ggplot2 in R?
https://www.tutorialspoint.com/how-to-change-the-y-axis-values-in-a-bar-plot-using-ggplot2-in-r
-
12-09-2020 - |
 italiano
 english
 français
 española
 中国
中国 日本の
日本の العربية
 Deutsch
 한국어
한국어 Português
 Russian
Question
How to change the Y-axis values in a bar plot using ggplot2 in R?
Bar plot is frequently used to analyze the number of times a level of factor variable occurs in a data set and the Y-axis values are crucial to the bar plot. Sometimes these values are not in the form we want, therefore, we want to replace them with the new ones. This can be done with the help of breaks argument of scale_y_continuous function in ggplot2.
Example
Consider the below data frame −
> set.seed(1)
> x<-rpois(50,5)
> df<-data.frame(x)
Loading ggplot2 package −
> library(ggplot2)
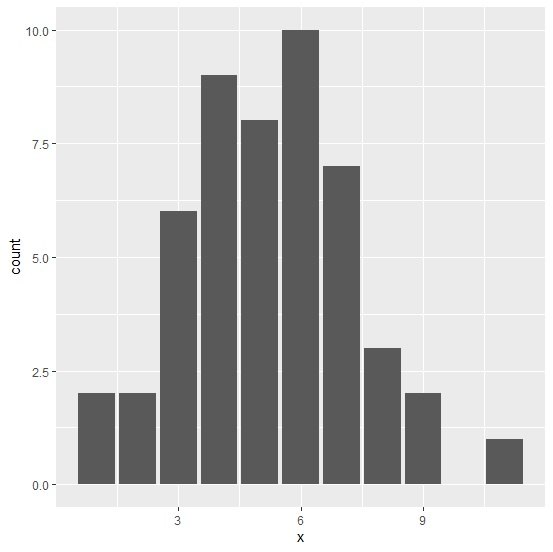
Creating the plot without specifying the Y-axis values −
> ggplot(df,aes(x))+
+ geom_bar()
Output
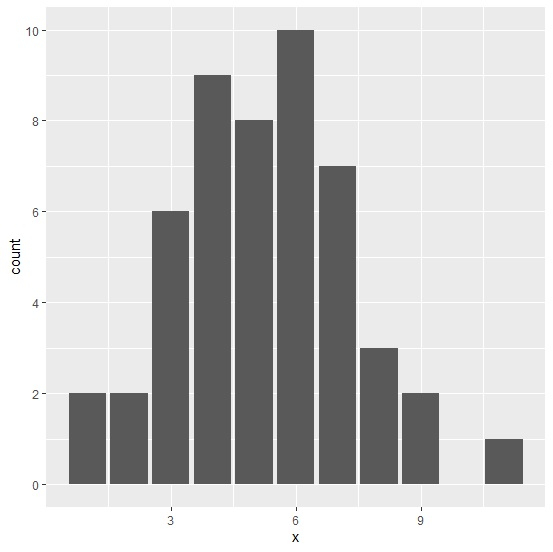
Plotting with new Y-axis values −
> ggplot(df,aes(x))+
+ geom_bar()+
+ scale_y_continuous(breaks=c(0,2,4,6,8,10))
Output

Published on 11-Aug-2020 11:18:26
Advertisements
Not affiliated with Tutorialspoint
