How to deal with warning “removed n rows containing missing values” while using ggplot2 in R?
-
12-09-2020 - |
 italiano
 english
 français
 española
 中国
中国 日本の
日本の العربية
 Deutsch
 한국어
한국어 Português
 Russian
Question
How to deal with warning “removed n rows containing missing values” while using ggplot2 in R?
The warning “removed n rows containing missing values” occurs when we incorrectly specify the range of the values for X-axis or Y-axis. We can this range in ggplot function using scale_x_continuous(limits=c(?,?)) for x axis and scale_y_continuous(limits=c(?,?)) for y axis. If the range will be larger than the actual data range then there will be no warning otherwise, we will get the warning for the number of missing values.
Example
Consider the below data frame −
> set.seed(2)
> x<-rnorm(20,0.5)
> y<-rpois(20,2)
> df<-data.frame(x,y)
Loading ggplot2 package −
> library(ggplot2)
Creating the plot with Y-axis limits from 0 to 5−
> ggplot(df,aes(x,y))+
+ geom_point()+
+ scale_y_continuous(limits=c(0,5))
Warning message:
Removed 1 rows containing missing values (geom_point).
Output
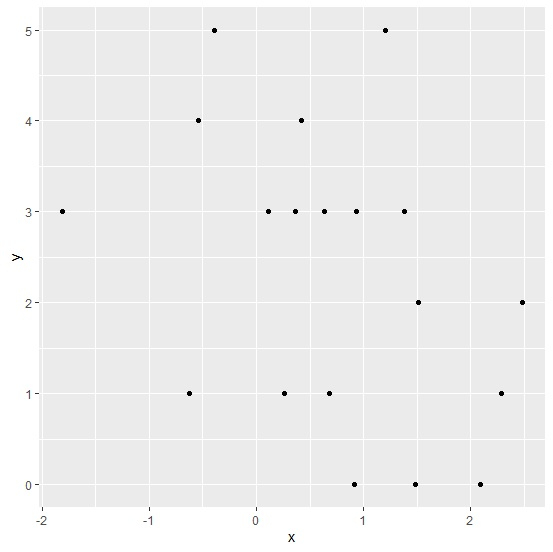
Here, we got a warning for 1 row with missing value. Now let’s create a plot with increasing one value for Y-axis −
> ggplot(df,aes(x,y))+
+ geom_point()+
+ scale_y_continuous(limits=c(0,6))
Output
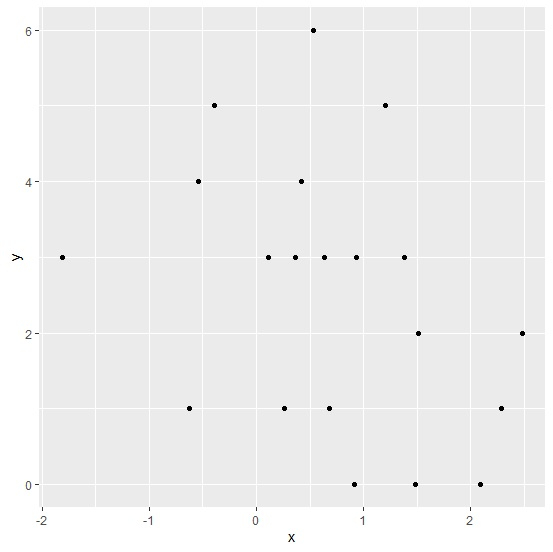
Here, we can see that 6 is added on the Y-axis and there are no warnings. We can also increase the limit depending on our need as shown below −
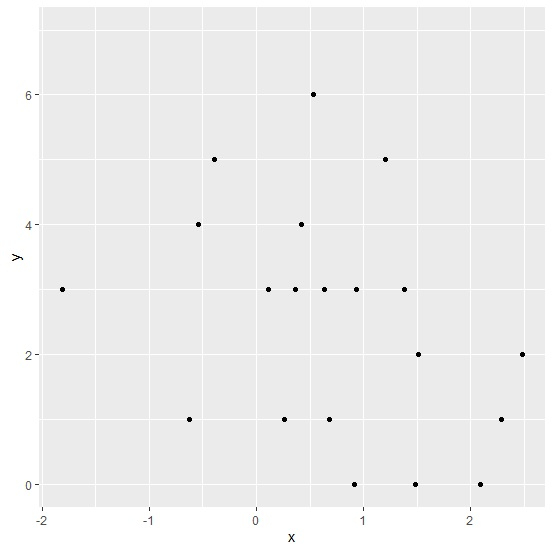
> ggplot(df,aes(x,y))+
+ geom_point()+
+ scale_y_continuous(limits=c(0,7))
Output