How to join points on a scatterplot with smooth lines in R using plot function?
-
12-09-2020 - |
 italiano
 english
 français
 española
 中国
中国 日本の
日本の العربية
 Deutsch
 한국어
한국어 Português
 Russian
Question
How to join points on a scatterplot with smooth lines in R using plot function?
It is very difficult to join points on a scatterplot with smooth lines if the scatteredness is high but we might want to look at the smoothness that cannot be understood by just looking at the points. It is also helpful to understand whether the model is linear or not. We can do this by plotting the model with loess using plot function.
Example
Consider the below data −
> set.seed(3)
> x<-sample(1:100,10,replace=TRUE)
> y<-rpois(10,100)
Using loess to create the smooth lines −
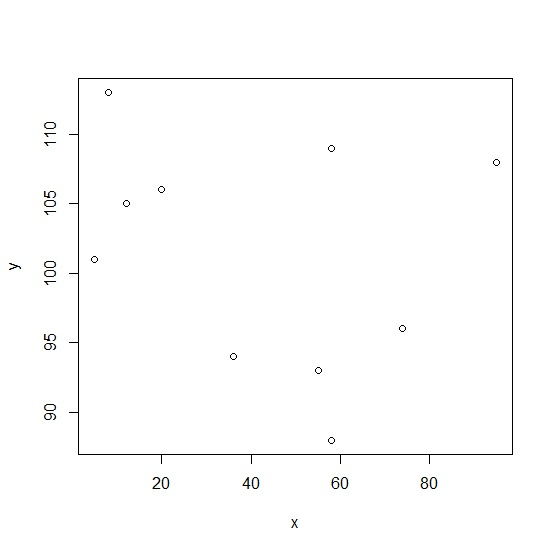
> Model <- loess(y~x)
> summary(Model)
Call:
loess(formula = y ~ x)
Number of Observations: 10
Equivalent Number of Parameters: 4.77
Residual Standard Error: 8.608
Trace of smoother matrix: 5.27 (exact)
Control settings:
span       : 0.75
degree     : 2
family     : gaussian
surface    : interpolate cell = 0.2
normalize  : TRUE
parametric : FALSE
drop.square: FALSE
> plot(x,y)
Output
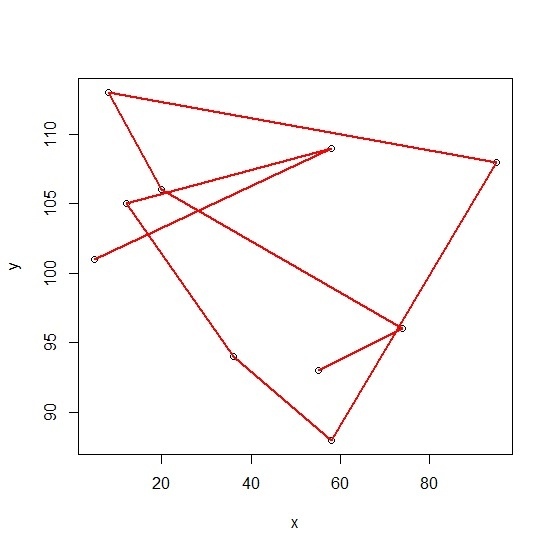
> lines(Model, col='red', lwd=2)
Output

Published on 10-Aug-2020 15:44:11
Advertisements
Not affiliated with Tutorialspoint
