Houghlines in MATLAB
 https://stackoverflow.com/questions/2062826
-
20-09-2019 - |
 italiano
 english
 français
 española
 中国
中国 日本の
日本の العربية
 Deutsch
 한국어
한국어 Português
 Russian
Question
After detecting the lines in an image using Hough lines, how can I use it to calculate the change in angle (rotation) of the lines of a reference image?
Solution
Note to readers: This is a follow-up question, refer to these for background:
- How to select maximum intensity in Hough transform in MATLAB?
- Calculating displacement moved in MATLAB
The process is similar to what I showed before. Below I am using the images from your previous question (since you provided only one, I created the other by rotating the first by 10 degrees).
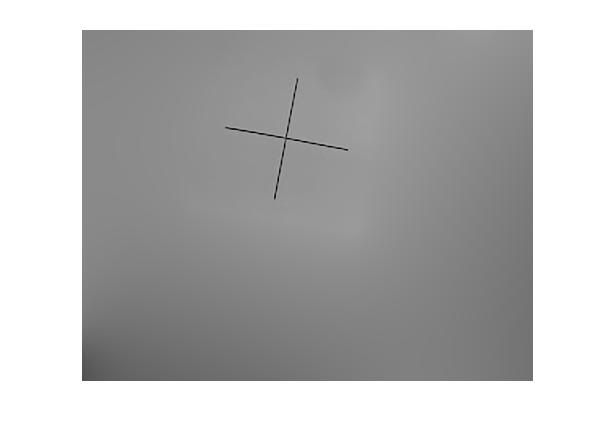
We start by detecting the lines for the two images. We do this with the help of the Hough transform functions. This what it looks like applied to both images:

Next, we want to perform image registration using the line endpoints as control-points. First, we make sure the points correspond to each other in the two images. I do this by computing the convex hull using convhull which automatically sorts them in counterclockwise-order (or is it in the opposite direction!). The numbers shown above indicate the order.
Finally, we use the function cp2tform to get the transformation matrix, which we use to align the images and extract the translation, rotation, and scaling.
The following is the complete code:
%% # Step 1: read and prepare images
%# (since you provided only one, I created the other by rotating the first).
I1 = imread('http://i.stack.imgur.com/Se6zX.jpg');
I1 = rgb2gray( imcrop(I1, [85   35  445  345]) ); %# Get rid of white border
I2 = imrotate(I1, -10, 'bilinear', 'crop'); %# Create 2nd by rotating 10 degrees

%% # Step 2: detect the cross sign endpoints (sorted in same order)
p1 = getCross(I1);
p2 = getCross(I2);

%% # Step 3: perform Image Registration
%# Find transformation that maps I2 to I1 using the 4 control points for each
t = cp2tform(p2,p1,'affine');

%# Transform I2 to be aligned with I1
II2 = imtransform(I2, t, 'XData',[1 size(I1,2)], 'YData',[1 size(I1,1)]);

%# Plot
figure('menu','none')
subplot(131), imshow(I1), title('I1')
subplot(132), imshow(I2), title('I2')
subplot(133), imshow(II2), title('I2 (aligned)')

%# Recover affine transformation params (translation, rotation, scale)
ss = t.tdata.Tinv(2,1);
sc = t.tdata.Tinv(1,1);
tx = t.tdata.Tinv(3,1);
ty = t.tdata.Tinv(3,2);
scale = sqrt(ss*ss + sc*sc)
rotation = atan2(ss,sc)*180/pi
translation = [tx ty]
And here's the function that extract the lines endpoints:
function points = getCross(I)
    %# Get edges (simply by thresholding)
    I = imfilter(I, fspecial('gaussian', [7 7], 1), 'symmetric');
    BW = imclearborder(~im2bw(I, 0.5));

    %# Hough transform
    [H,T,R] = hough(BW);

    %# Detect peaks
    P  = houghpeaks(H, 2);

    %# Detect lines
    lines = houghlines(BW, T, R, P);

    %# Sort 2D points in counterclockwise order
    points = [vertcat(lines.point1); vertcat(lines.point2)];
    idx = convhull(points(:,1), points(:,2));
    points = points(idx(1:end-1),:);
end
with the result:

scale =
    1.0025
rotation =
   -9.7041
translation =
   32.5270  -38.5021
The rotation is recovered as almost 10 degrees (with some inevitable error), and scaling is effectively 1 (meaning there was no zooming). Note that there was a translation component in the above example, because rotation was not performed around the center of the cross sign).
OTHER TIPS
I am not sure what the MATLAB implementation of the Hough transform is, but the orientation of the line will be simply be at a right angle (90 degrees or pi/2 radians) to the angle you've used to identify the line in the first place.
I hope that helps. There's decent coverage of Hough transforms on the web and Wikipedia is a good place to start.
