Plot inverse colors in Matlab?
 https://stackoverflow.com/questions/2372949
 italiano
 english
 français
 española
 中国
中国 日本の
日本の العربية
 Deutsch
 한국어
한국어 Português
 Russian
Question
I'm plotting on top of an image in Matlab. Sometimes, I can't see what's being plotted because the color of the image underneath is too close to the color of the image at the same location. I could just always change the color of the plot (e.g. from 'rx' to 'bx'), but that's cumbersome.
Is it possible to plot the inverse color of what's underneath so that the overlay is always visible?
Solution
I believe it's not possible to automatically invert color of the plot based on background image. You probably can rasterize the plot and somehow combine it with the image (xor?).
Here is another solution. If you can use closed markers, like circle, square, triangle, you can set different MarkerEdgeColor and MarkerFaceColor, so the marker will be visible against different colors.
h = plot(1:5,'o');
set(h,'MarkerEdgeColor','b')
set(h,'MarkerFaceColor','r')
OTHER TIPS
This is possible.
Assuming you know what your image is like, you can do the following:
Read the color at the coordinates over which you plot
Invert the color
Use scatter
%# load rgb color image - this is maybe not the best example, since it's all so dark. X = double(imread('ngc6543a.jpg'))/255; %# since it's quite a dark image, invert half of it X(:,1:floor(size(X,2)/2),:) = 1-X(:,1:floor(size(X,2)/2),:);
%# create some plot data plotX = rand(50,1) * size(X,1); plotY = rand(50,1) * size(X,2);
%# read RGB components (it must be possible to do this more efficently, but I don't see %# it right now plotColors = zeros(length(plotX),3); for c = 1:3 plotColors(:,c) = interp2(X(:,:,c),plotY,plotX); end
%# invert plotColors = 1-plotColors; %# If you want highly different colors, and avoid the problem that grey is the inverse %# to grey, you could use %# plotColors = round(1-plotColors); %# This gives you the choice of wrgbcmyk, whichever is farthest from the image color
%# plot figure,imshow(X) hold on scatter(plotY,plotX,[],plotColors)
Edit: this has now been tested and it should work.
Edit2: inverting half the original image makes it clearer how this works
Edit3: incorporated a modified form of gnovice's suggestion
Edit4: fixed the bug as pointed out by AB
There's no automated way I know of to have your plotted points change color based on the color of the pixel behind them. Keep in mind that you don't have to use just the eight predefined color specifications (i.e. 'r' for red or 'b' for blue). You could pick an RGB color specification for your plotted points that isn't common in your underlying image. For example:
h = plot(0,0,'Marker','x','Color',[1 0.4 0.6]); %# Plot a pink x
You could programmatically find the least common color with some simple code that picks the least frequently used color values in an image. Here's one example:
rawData = imread('peppers.png');  %# Read a sample RGB image
imData = reshape(rawData,[],3);   %# Reshape the image data
N = hist(double(imData),0:255);   %# Create a histogram for the RGB values
[minValue,minIndex] = min(N);     %# Find the least used RGB values
plotColor = (minIndex-1)./255;    %# The color for the plotted points
image(rawData);                   %# Plot the image
hold on;
hp = plot(500.*rand(1,20),350.*rand(1,20),...  %# Plot some random points
          'Marker','o','LineStyle','none',...
          'MarkerFaceColor',plotColor,'MarkerEdgeColor',plotColor);
The above code first reshapes the image data into an M-by-3 matrix, where M is the number of image pixels and the three columns contain the red, green, and blue values, respectively. A binning of values is done for each column using HIST, then the value with the smallest bin (i.e. lowest frequency) is found for each column. These three values become the RGB triple for the plot color. When the image is overlaid with random points of this color, it gives the following plot:
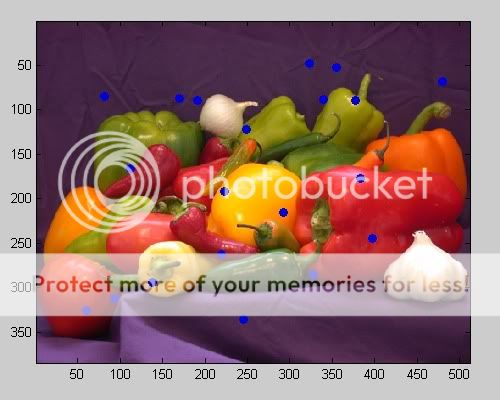
Notice in this case that the above code picks a bright blue color for the plot points, which happens to be a color not appearing in the image and thus giving good contrast.
This is very simple and looks fairly nice, if you need to plot scattered points:
%# load rgb color image
X = double(imread('ngc6543a.jpg'))/255;
%# since it's quite a dark image, invert half of it
X(:,1:floor(size(X,2)/2),:) = 1-X(:,1:floor(size(X,2)/2),:);

%# create some plot data
plotX = rand(50,1) * size(X,1);
plotY = rand(50,1) * size(X,2);

%# plot
figure,imshow(X)
hold on
scatter(plotY,plotX,'xw');
scatter(plotY,plotX,'ok');
If you need something more complicated, leave me a comment.
