Domanda

I have a 132 x 107 dataset which consists of 2 patient types - (33 of patient 1) and (99 of patient 2).

I'm looking for outliers so I've run pca on the dataset and done qqplots of the 1st 4 components, using the following commands

pca = prcomp(data, scale. = TRUE)
plot(pca$x, pch = 20, col = c(rep("red", 33), rep("blue", 99)))  

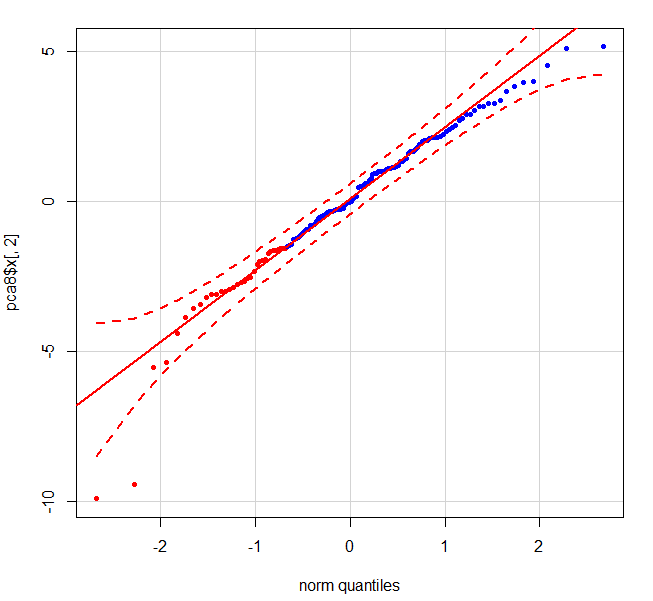
When I do the qqplot of the 2nd component using:

qqPlot(pca$x[,2],pch = 20, col = c(rep("red", 33), rep("blue", 99)))     

the following graph shows 2 clear outliers - the red dots in the bottom left corner which are patient 1s.

QQ Plot

Is there any straightforward way of working out the index of these points in the data so they can be removed?

È stato utile?

Soluzione

For some reason, I don't believe that the identify method is supported in the car package (the source of qqPlot())

Let's take a look at a PCA of the USArrests data...

pca <- prcomp(USArrests) 

The plot of this using qqPlot is easy enough.

require(car)
qqPlot(pca$x[,2],pch = 20, col = c(rep("red", 33), rep("blue", 99)))

However, qqPlot() does not allow for point selection via identify().

identify(qqPlot(pca$x[,2],pch = 20, col = c(rep("red", 33), rep("blue", 99))))
# numeric(0)

You can, however, make use of qqnorm() in the stats package.

identify(qqnorm(pca$x[,2],pch = 20, col = c(rep("red", 33), rep("blue", 99))))

This will produce a less sophisticated graph, but you should be able to add a line and confidence intervals manually via qqline() (also in stats) and a little more math.
Altri suggerimenti

You can try the identify method in R. Typically, run

identify(qqPlot(pca$x[,2],pch = 20, col = c(rep("red", 33), rep("blue", 99))))

and left-click on the points which you want to identify. The index of the points in the score vector should be the same as in the original data.

You can also visualize influence using the fviz_pca_ind() function in the factoextra library, as follows:

require(factoextra)
pca = prcomp(mydata)
fviz_pca_ind(pca,
         col.ind = "contrib", # Color by contribution
         gradient.cols = c("#00AFBB", "#E7B800", "#FC4E07") #assign gradient
         )

This automatically labels the individuals, and colours them by their influence.

Autorizzato sotto: CC-BY-SA insieme a attribuzione
Non affiliato a StackOverflow
scroll top