How to create gridlines that matches with Y-axis values in the plot created by using plot function in R?
-
10-09-2020 - |
 italiano
 english
 français
 española
 中国
中国 日本の
日本の العربية
 Deutsch
 한국어
한국어 Português
 Russian
문제
How to create gridlines that matches with Y-axis values in the plot created by using plot function in R?
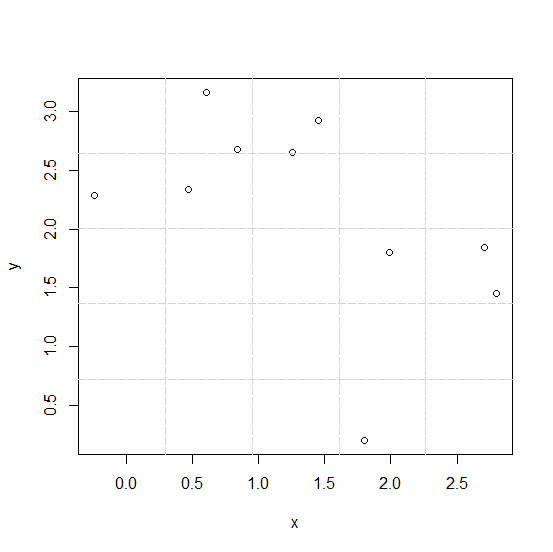
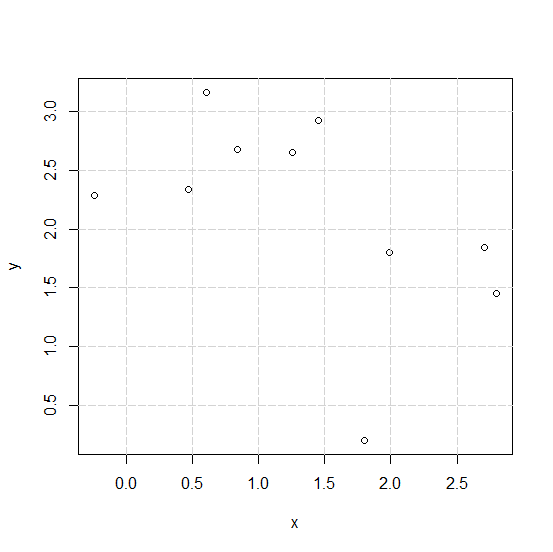
When we create a plot in R and draw gridlines then the gridlines are drawn on the basis of the values provided inside the grid function, therefore, it may or may not match with the Y-axis labels. But it can be done, we just need to set the values inside the grid function to NULL.
Example
Consider the below plot −
x<-rnorm(10,1)
y<-rnorm(10,2)
plot(x,y)
grid(5,5,lty=5)
Output
Creating the plot with gridlines that matches with Y-axis labels −
Example
plot(x,y)
grid(NULL,NULL,lty=5)
Output

Published on 09-Sep-2020 11:35:25
Advertisements
제휴하지 않습니다 Tutorialspoint
