How to create line chart for all columns of a data frame a in R?
https://www.tutorialspoint.com/how-to-create-line-chart-for-all-columns-of-a-data-frame-a-in-r
-
12-09-2020 - |
 italiano
 english
 français
 española
 中国
中国 日本の
日本の العربية
 Deutsch
 한국어
한국어 Português
 Russian
문제
How to create line chart for all columns of a data frame a in R?
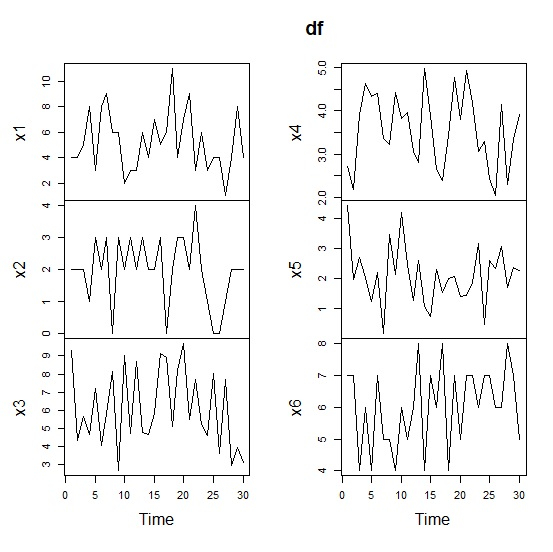
To check the trend of all columns of a data frame, we need to create line charts for all of those columns. These line charts help us to understand how data points fall or rise for the columns. Once we know the trend, we can try to find the out the reasons behind them and take appropriate actions. We can plot line charts for each of the column by using plot.ts function that plots data as a time series.
Example
Consider the below data frame.
> set.seed(1)
> x1<-rpois(30,5)
> x2<-rpois(30,2)
> x3<-runif(30,2,10)
> x4<-runif(30,2,5)
> x5<-rnorm(30,2)
> x6<-rbinom(30,10,0.6)
> df<-data.frame(x1,x2,x3,x4,x5,x6)
> head(df,20)
x1 x2 x3 x4 x5 x6
1 4 2 9.303007 2.718888 4.4016178 7
2 4 2 4.348827 2.176803 1.9607600 7
3 5 2 5.672526 3.926865 2.6897394 4
4 8 1 4.659157 4.628808 2.0280022 6
5 3 3 7.206964 4.336744 1.2567268 4
6 8 2 4.064134 4.391926 2.1887923 7
7 9 3 5.828362 3.365823 0.1950414 5
8 6 0 8.130485 3.230252 3.4655549 5
9 6 3 2.673975 4.432611 2.1532533 4
10 2 2 9.002571 3.814800 4.1726117 6
11 3 3 4.712584 3.964172 2.4755095 5
12 3 2 8.715523 3.059592 1.2900536 6
13 6 3 4.773468 2.810780 2.6107264 8
14 4 2 4.670199 4.978052 1.0659024 4
15 7 2 5.810810 3.900480 0.7463666 7
16 5 3 9.137587 2.639624 2.2914462 6
17 6 0 8.914716 2.388117 1.5567081 8
18 11 2 5.119916 3.434354 2.0011054 4
19 4 3 8.218566 4.772223 2.0743413 7
20 7 3 9.684944 3.796283 1.4104791 5
Plotting all the columns as a time series −
> plot.ts(df)
Output

Published on 11-Aug-2020 15:59:35
Advertisements
제휴하지 않습니다 Tutorialspoint
