Drawing a Web Graph [closed]
 https://stackoverflow.com/questions/69275
-
09-06-2019 - |
 italiano
 english
 français
 española
 中国
中国 日本の
日本の العربية
 Deutsch
 한국어
한국어 Português
 Russian
Question
I'm trying to draw a graph on an ASP webpage. I'm hoping an API can be helpful, but so far I have not been able to find one.
The graph contains labeled nodes and unlabeled directional edges. The ideal output would be something like this.
Anybody know of anything pre-built than can help?
Solution
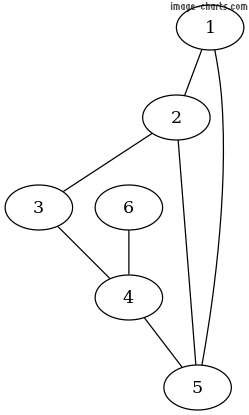
Definitely graphviz. The image on the wikipedia link you are pointing at was made in graphviz. From its description page the graph description file looked like this:
graph untitled {
    graph[bgcolor="transparent"];
    node [fontname="Bitstream Vera Sans", fontsize="22.00", shape=circle, style="bold,filled" fillcolor=white];
    edge [style=bold];
    1;2;3;4;5;6;
    6 -- 4 -- 5 -- 1 -- 2 -- 3 -- 4;
    2 -- 5;
}
If that code were saved into a file input.dot, the command they would have used to actually generate the graph would probably have been:
neato -Tsvg input.dot > graph.svg
OTHER TIPS
I am not sure about ASP interface, but you may want to check out graphviz.
/Allan
We produce mxGraph, which supports ASP.NET, and most other mainstream server-side technologies. It's entirely JavaScript client-side, with just a thin layer to communicate written in .NET, so there isn't much ASP.NET required. But we do supply a ASP project for visual studio as one of the examples.
I would recommend zedgraph
You could use QuickGraph to easily model the graph programatically, then export it to GraphViz or GLEE, then render it to PNG.
Well, here's another answer 2 years later. Protovis now does force-directed graph layouts rendered in browser: http://vis.stanford.edu/protovis/ex/force.html Might be easier if you can't install client-side software. Also it's fun and interactive!
You might be able to pull this off with Google's Chart API. It is very easy to get started with.
Disclaimer: I'm Image-Charts founder.
If you are looking for an web API:
https://image-charts.com/chart
?cht=gv
&chl=graph g{1;2;3;4;5;6; 6 -- 4 -- 5 -- 1 -- 2 -- 3 -- 4; 2 -- 5;)
