Fast Algorithm for computing percentiles to remove outliers
 https://stackoverflow.com/questions/3779763
-
04-10-2019 - |
 italiano
 english
 français
 española
 中国
中国 日本の
日本の العربية
 Deutsch
 한국어
한국어 Português
 Russian
Question
I have a program that needs to repeatedly compute the approximate percentile (order statistic) of a dataset in order to remove outliers before further processing. I'm currently doing so by sorting the array of values and picking the appropriate element; this is doable, but it's a noticable blip on the profiles despite being a fairly minor part of the program.
More info:
- The data set contains on the order of up to 100000 floating point numbers, and assumed to be "reasonably" distributed - there are unlikely to be duplicates nor huge spikes in density near particular values; and if for some odd reason the distribution is odd, it's OK for an approximation to be less accurate since the data is probably messed up anyhow and further processing dubious. However, the data isn't necessarily uniformly or normally distributed; it's just very unlikely to be degenerate.
- An approximate solution would be fine, but I do need to understand how the approximation introduces error to ensure it's valid.
- Since the aim is to remove outliers, I'm computing two percentiles over the same data at all times: e.g. one at 95% and one at 5%.
- The app is in C# with bits of heavy lifting in C++; pseudocode or a preexisting library in either would be fine.
- An entirely different way of removing outliers would be fine too, as long as it's reasonable.
- Update: It seems I'm looking for an approximate selection algorithm.
Although this is all done in a loop, the data is (slightly) different every time, so it's not easy to reuse a datastructure as was done for this question.
Implemented Solution
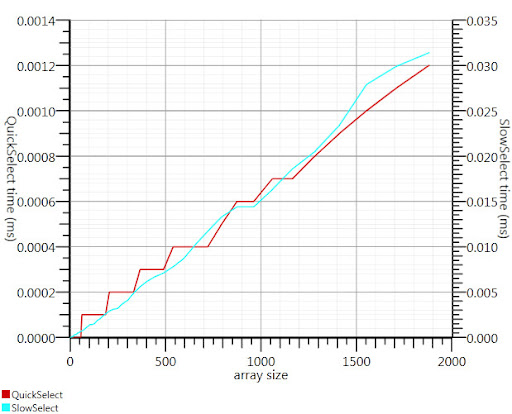
Using the wikipedia selection algorithm as suggested by Gronim reduced this part of the run-time by about a factor 20.
Since I couldn't find a C# implementation, here's what I came up with. It's faster even for small inputs than Array.Sort; and at 1000 elements it's 25 times faster.
public static double QuickSelect(double[] list, int k) {
    return QuickSelect(list, k, 0, list.Length);
}
public static double QuickSelect(double[] list, int k, int startI, int endI) {
    while (true) {
        // Assume startI <= k < endI
        int pivotI = (startI + endI) / 2; //arbitrary, but good if sorted
        int splitI = partition(list, startI, endI, pivotI);
        if (k < splitI)
            endI = splitI;
        else if (k > splitI)
            startI = splitI + 1;
        else //if (k == splitI)
            return list[k];
    }
    //when this returns, all elements of list[i] <= list[k] iif i <= k
}
static int partition(double[] list, int startI, int endI, int pivotI) {
    double pivotValue = list[pivotI];
    list[pivotI] = list[startI];
    list[startI] = pivotValue;

    int storeI = startI + 1;//no need to store @ pivot item, it's good already.
    //Invariant: startI < storeI <= endI
    while (storeI < endI && list[storeI] <= pivotValue) ++storeI; //fast if sorted
    //now storeI == endI || list[storeI] > pivotValue
    //so elem @storeI is either irrelevant or too large.
    for (int i = storeI + 1; i < endI; ++i)
        if (list[i] <= pivotValue) {
            list.swap_elems(i, storeI);
            ++storeI;
        }
    int newPivotI = storeI - 1;
    list[startI] = list[newPivotI];
    list[newPivotI] = pivotValue;
    //now [startI, newPivotI] are <= to pivotValue && list[newPivotI] == pivotValue.
    return newPivotI;
}
static void swap_elems(this double[] list, int i, int j) {
    double tmp = list[i];
    list[i] = list[j];
    list[j] = tmp;
}
Thanks, Gronim, for pointing me in the right direction!
Solution
The histogram solution from Henrik will work. You can also use a selection algorithm to efficiently find the k largest or smallest elements in an array of n elements in O(n). To use this for the 95th percentile set k=0.05n and find the k largest elements.
Reference:
http://en.wikipedia.org/wiki/Selection_algorithm#Selecting_k_smallest_or_largest_elements
OTHER TIPS
You could estimate your percentiles from just a part of your dataset, like the first few thousand points.
The Glivenko–Cantelli theorem ensures that this would be a fairly good estimate, if you can assume your data points to be independent.
I used to identify outliers by calculating the standard deviation. Everything with a distance more as 2 (or 3) times the standard deviation from the avarage is an outlier. 2 times = about 95%.
Since your are calculating the avarage, its also very easy to calculate the standard deviation is very fast.
You could also use only a subset of your data to calculate the numbers.
Divide the interval between minimum and maximum of your data into (say) 1000 bins and calculate a histogram. Then build partial sums and see where they first exceed 5000 or 95000.
There are a couple basic approaches I can think of. First is to compute the range (by finding the highest and lowest values), project each element to a percentile ((x - min) / range) and throw out any that evaluate to lower than .05 or higher than .95.
The second is to compute the mean and standard deviation. A span of 2 standard deviations from the mean (in both directions) will enclose 95% of a normally-distributed sample space, meaning your outliers would be in the <2.5 and >97.5 percentiles. Calculating the mean of a series is linear, as is the standard dev (square root of the sum of the difference of each element and the mean). Then, subtract 2 sigmas from the mean, and add 2 sigmas to the mean, and you've got your outlier limits.
Both of these will compute in roughly linear time; the first one requires two passes, the second one takes three (once you have your limits you still have to discard the outliers). Since this is a list-based operation, I do not think you will find anything with logarithmic or constant complexity; any further performance gains would require either optimizing the iteration and calculation, or introducing error by performing the calculations on a sub-sample (such as every third element).
A good general answer to your problem seems to be RANSAC.
Given a model, and some noisy data, the algorithm efficiently recovers the parameters of the model.
You will have to chose a simple model that can map your data. Anything smooth should be fine. Let say a mixture of few gaussians. RANSAC will set the parameters of your model and estimate a set of inliners at the same time. Then throw away whatever doesn't fit the model properly.
You could filter out 2 or 3 standard deviation even if the data is not normally distributed; at least, it will be done in a consistent manner, that should be important.
As you remove the outliers, the std dev will change, you could do this in a loop until the change in std dev is minimal. Whether or not you want to do this depends upon why are you manipulating the data this way. There are major reservations by some statisticians to removing outliers. But some remove the outliers to prove that the data is fairly normally distributed.
Not an expert, but my memory suggests:
- to determine percentile points exactly you need to sort and count
- taking a sample from the data and calculating the percentile values sounds like a good plan for decent approximation if you can get a good sample
- if not, as suggested by Henrik, you can avoid the full sort if you do the buckets and count them
One set of data of 100k elements takes almost no time to sort, so I assume you have to do this repeatedly. If the data set is the same set just updated slightly, you're best off building a tree (O(N log N)) and then removing and adding new points as they come in (O(K log N) where K is the number of points changed). Otherwise, the kth largest element solution already mentioned gives you O(N) for each dataset.
